


Prediction market analysis is the process of deciding whether a market price is too high, too low, or roughly fair. It is not just reading a chart and guessing. A useful analysis workflow combines price, liquidity, rules, sources, and your own probability estimate.
This guide gives beginners a repeatable method for reading prediction markets without treating every price move as truth. If you need the math first, start with Probability Pricing Explained. If you want examples of how prices move around news, read How Traders Read Probability Movements.
What Analysis Means in Prediction Markets
A market price is a live estimate. Analysis asks whether that estimate is defensible. You are looking for the gap between:
- what the market currently implies;
- what the best available evidence suggests;
- what it would cost to enter or exit the position; and
- what could go wrong in resolution.
If those pieces do not line up, you do not have a clean signal. You have a hunch.
The Four-Layer Analysis Stack
| Layer | What to check | Question to answer |
|---|---|---|
| Price | Current implied probability and recent movement. | What is the market saying now? |
| Liquidity | Spread, depth, volume, and whether the move happened on real trading. | Can this price be trusted enough to act on? |
| Evidence | Official sources, data releases, event calendars, and credible reporting. | What changed in the real world? |
| Rules | Resolution source, deadline, and edge cases. | Could the market settle differently than the headline suggests? |
Tool 1: The Order Book
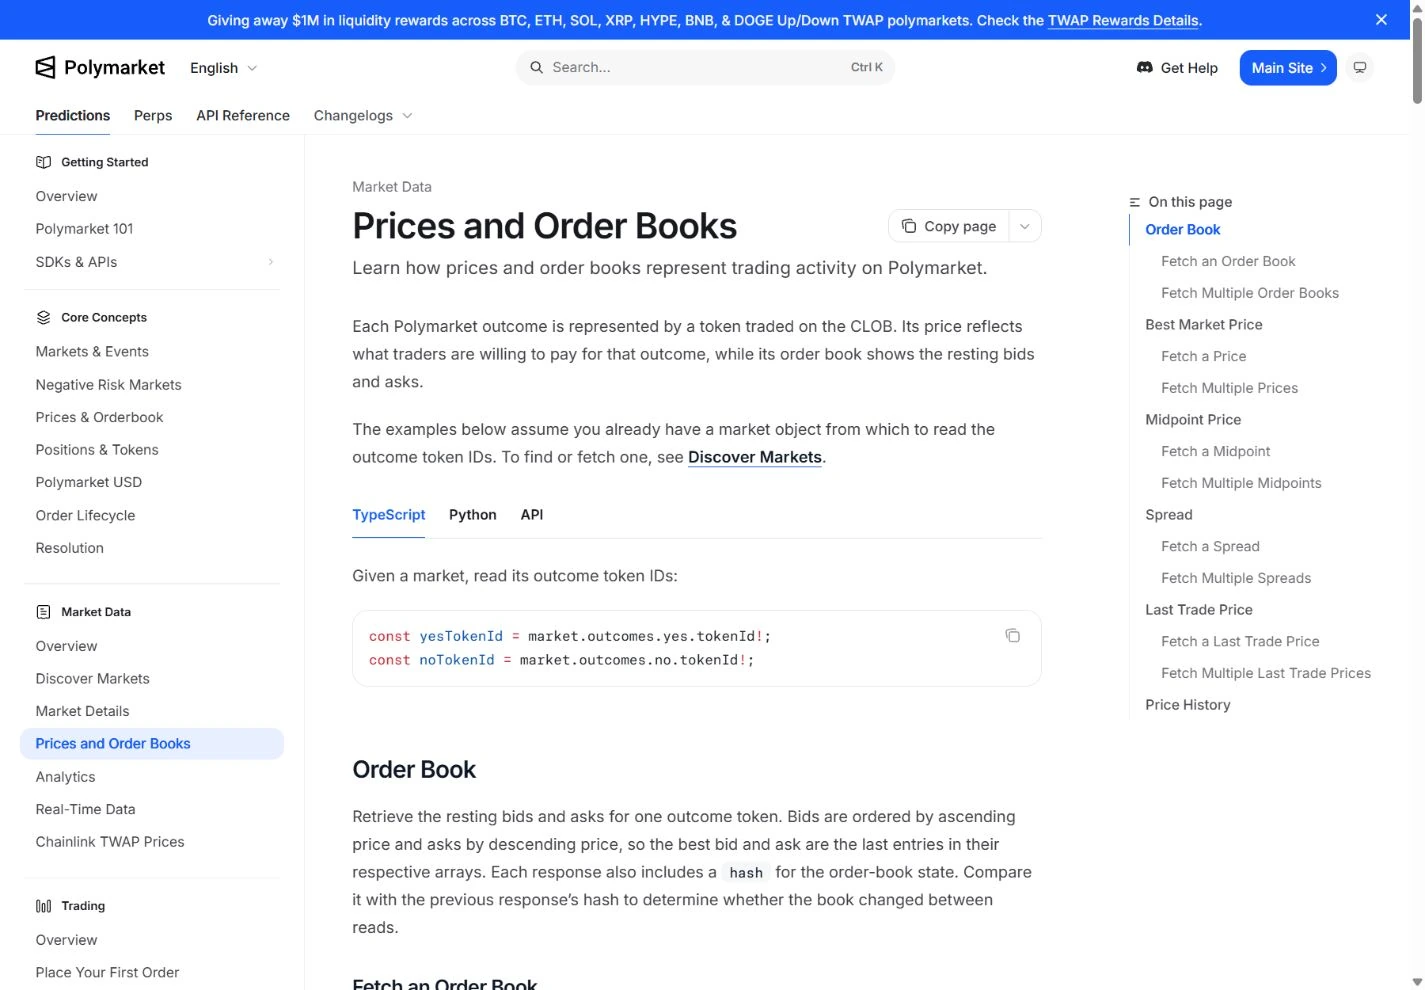
The order book shows where people are actually willing to buy and sell. Polymarket’s official documentation explains displayed probability, bid, ask, spread, and order-book mechanics in its prices and orderbook guide. Kalshi’s API documentation explains its own bid arrays and how to calculate implied asks and spreads in Kalshi orderbook responses.
For analysis, the key question is not just “what is the price?” It is “can I trade near that price without moving the market or paying too much spread?” Thin books can make a displayed probability look more precise than it really is.
Tool 2: Source Checklists
Every market category needs a different source habit:
- Economic markets: official release calendars, data tables, and central-bank statements.
- Weather markets: official forecasts, advisories, and named measurement sources.
- Sports markets: official league results, injury reports, schedules, and rules.
- Politics markets: official election offices, court filings, certification notices, and reputable result calls where the market rules allow them.
Use the source named in the market rules first. Then use other sources to understand whether the market is reacting before the final settlement source updates.
Tool 3: A Trade Journal
A simple journal prevents hindsight bias. For each trade idea, record:
- market question and URL;
- price, bid, ask, and spread when you looked;
- your estimated probability;
- the source evidence behind that estimate;
- the resolution rule you checked;
- maximum loss and planned exit condition.
The journal is not only for active traders. It is also useful for researchers who want to learn whether they systematically overreact to certain types of news.
Three Practical Methods
1. Fundamental Analysis
Start with the real-world variables that should drive the outcome. For a rate decision, that might mean inflation, employment, central-bank communication, and market-implied rate paths. For a sports market, it might mean injuries, schedule, weather, and matchup data.
2. Flow and Liquidity Analysis
Look at whether the move happened on meaningful volume and whether the order book supports the new price. A one-cent move on heavy volume means something different from a five-cent jump in a thin market.
3. Post-Event Review
After the market resolves, compare your pre-trade probability, the market price, and the final result. The goal is not to celebrate wins. The goal is to learn whether your process was better than the market for the right reason.
A 10-Minute Beginner Workflow
- Translate the market price into implied probability.
- Check bid, ask, spread, and rough depth.
- Read the full resolution rules.
- Find the named source or closest official source.
- Write your own probability estimate and reason.
- Use the YES/NO Contract Calculator to check maximum loss and payout path.
- Pass if the edge disappears after costs, uncertainty, or rule risk.
Common Analysis Mistakes
- Using price movement as proof. A market can move because one large trader cleared the book.
- Ignoring the rules. Good evidence is not enough if the market resolves on a narrower source.
- Overfitting one case study. A pattern from one event type may not transfer to another.
- Following large traders blindly. They may have a different time horizon, risk limit, or reason than you.
- Forgetting opportunity cost. Slow or disputed markets can tie up capital even when the thesis is right.
Where to Go Next
For strategy examples, use Event Trading Strategies. For live-market discovery, use the Prediction Market Scanner. For the full sequence, return to the Guides hub.
Source and Update Notes
This page uses official Polymarket and Kalshi documentation for order-book mechanics. The workflow is educational and does not recommend any market, platform, or trade. Last reviewed: 2026-07-04.
FAQ
Do I need a model to analyze prediction markets?
No. A simple written estimate with sources, rules, spread, and maximum loss is better than an unsupported opinion.
Is chart analysis enough?
No. Charts show what happened to price, not why it happened or whether the rules support the trade idea.
What is the easiest first habit?
Write down the market price, your probability estimate, and the rule source before acting. That one habit catches many weak trades.