


Michigan beat UConn 69–63 to win the 2026 men’s NCAA championship. A dated Kalshi News report put Michigan at 74% on the day of the final; the completed event page now shows Michigan Yes and $311,548,485 of displayed volume. The useful comparison is between that documented forecast and the official result—not a reconstructed halftime price unsupported by a trade record.
Updated October 8, 2026. Evidence review prepared with Codex; original author retained. All six source captures were taken on October 8. The April 6 news report is a historical source viewed on that date of capture.
1. What happened in the championship
Michigan won at Lucas Oil Stadium in Indianapolis, finishing 37–3 and taking its first men’s national title since 1989. NCAA’s official report records 70,720 spectators, Elliot Cadeau’s 19 points and Michigan’s 25 successful free throws from 28 attempts.
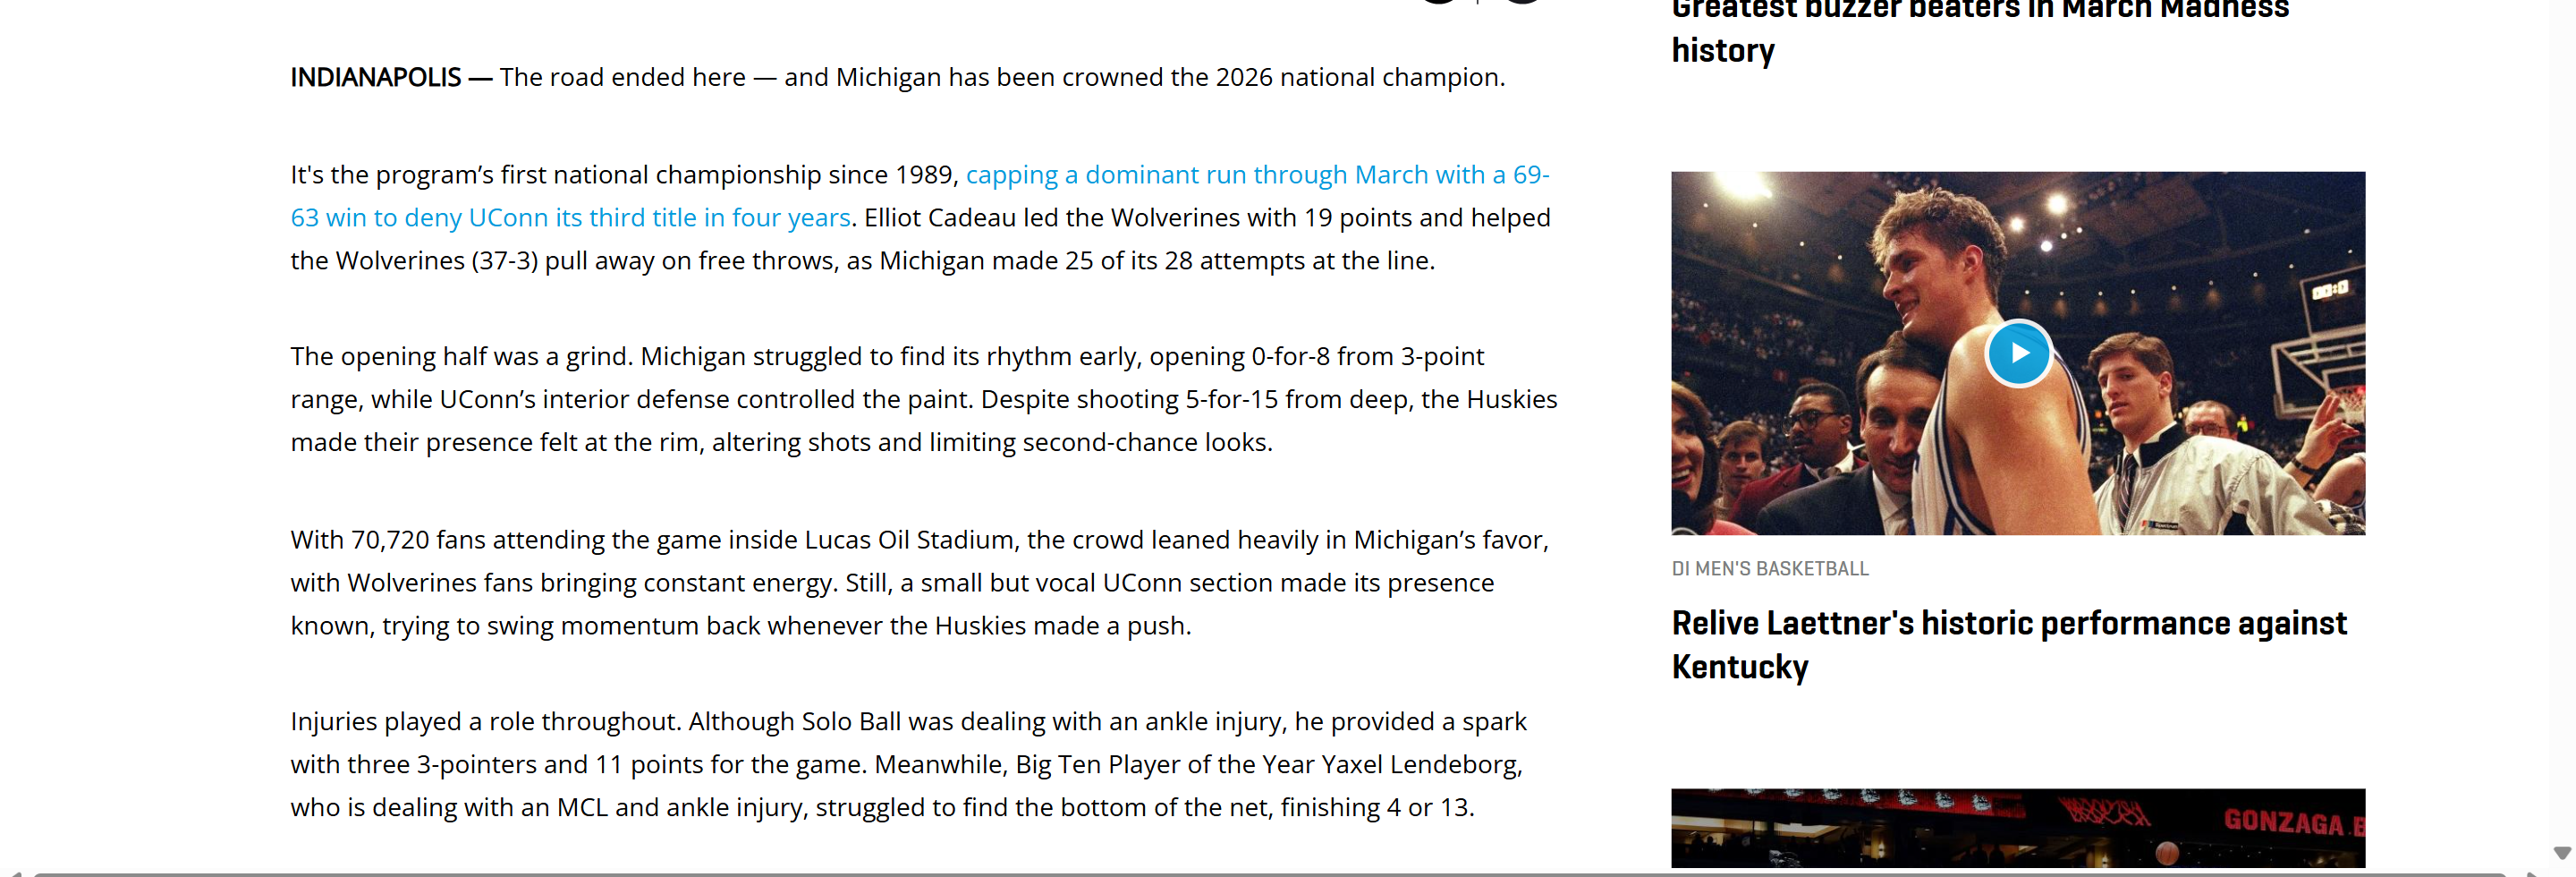
The finalists were No. 1 seed Michigan and No. 2 seed UConn. The official UConn box score records Michigan leading 33–29 at halftime, then scoring 36 points to UConn’s 34 after the break. It does not support a halftime UConn lead.
| Team | First half | Second half | Final |
|---|---|---|---|
| Michigan | 33 | 36 | 69 |
| UConn | 29 | 34 | 63 |
Michigan’s tournament route before the final ran through Howard, Saint Louis, Alabama, Tennessee and Arizona. The dated Kalshi report below lists those opponents. Purdue was Michigan’s Big Ten tournament final opponent, not its NCAA Final Four opponent. Keeping those competitions separate prevents a plausible-sounding but incorrect tournament narrative.
2. The dated forecast: Michigan 74%
Gabriel Santiago’s Kalshi News report, published April 6, quotes Michigan at 74% and UConn at 27¢. It reports nearly $230M of volume at that earlier observation. We preserve both quoted values rather than silently changing UConn to 26% to force a sum of 100.
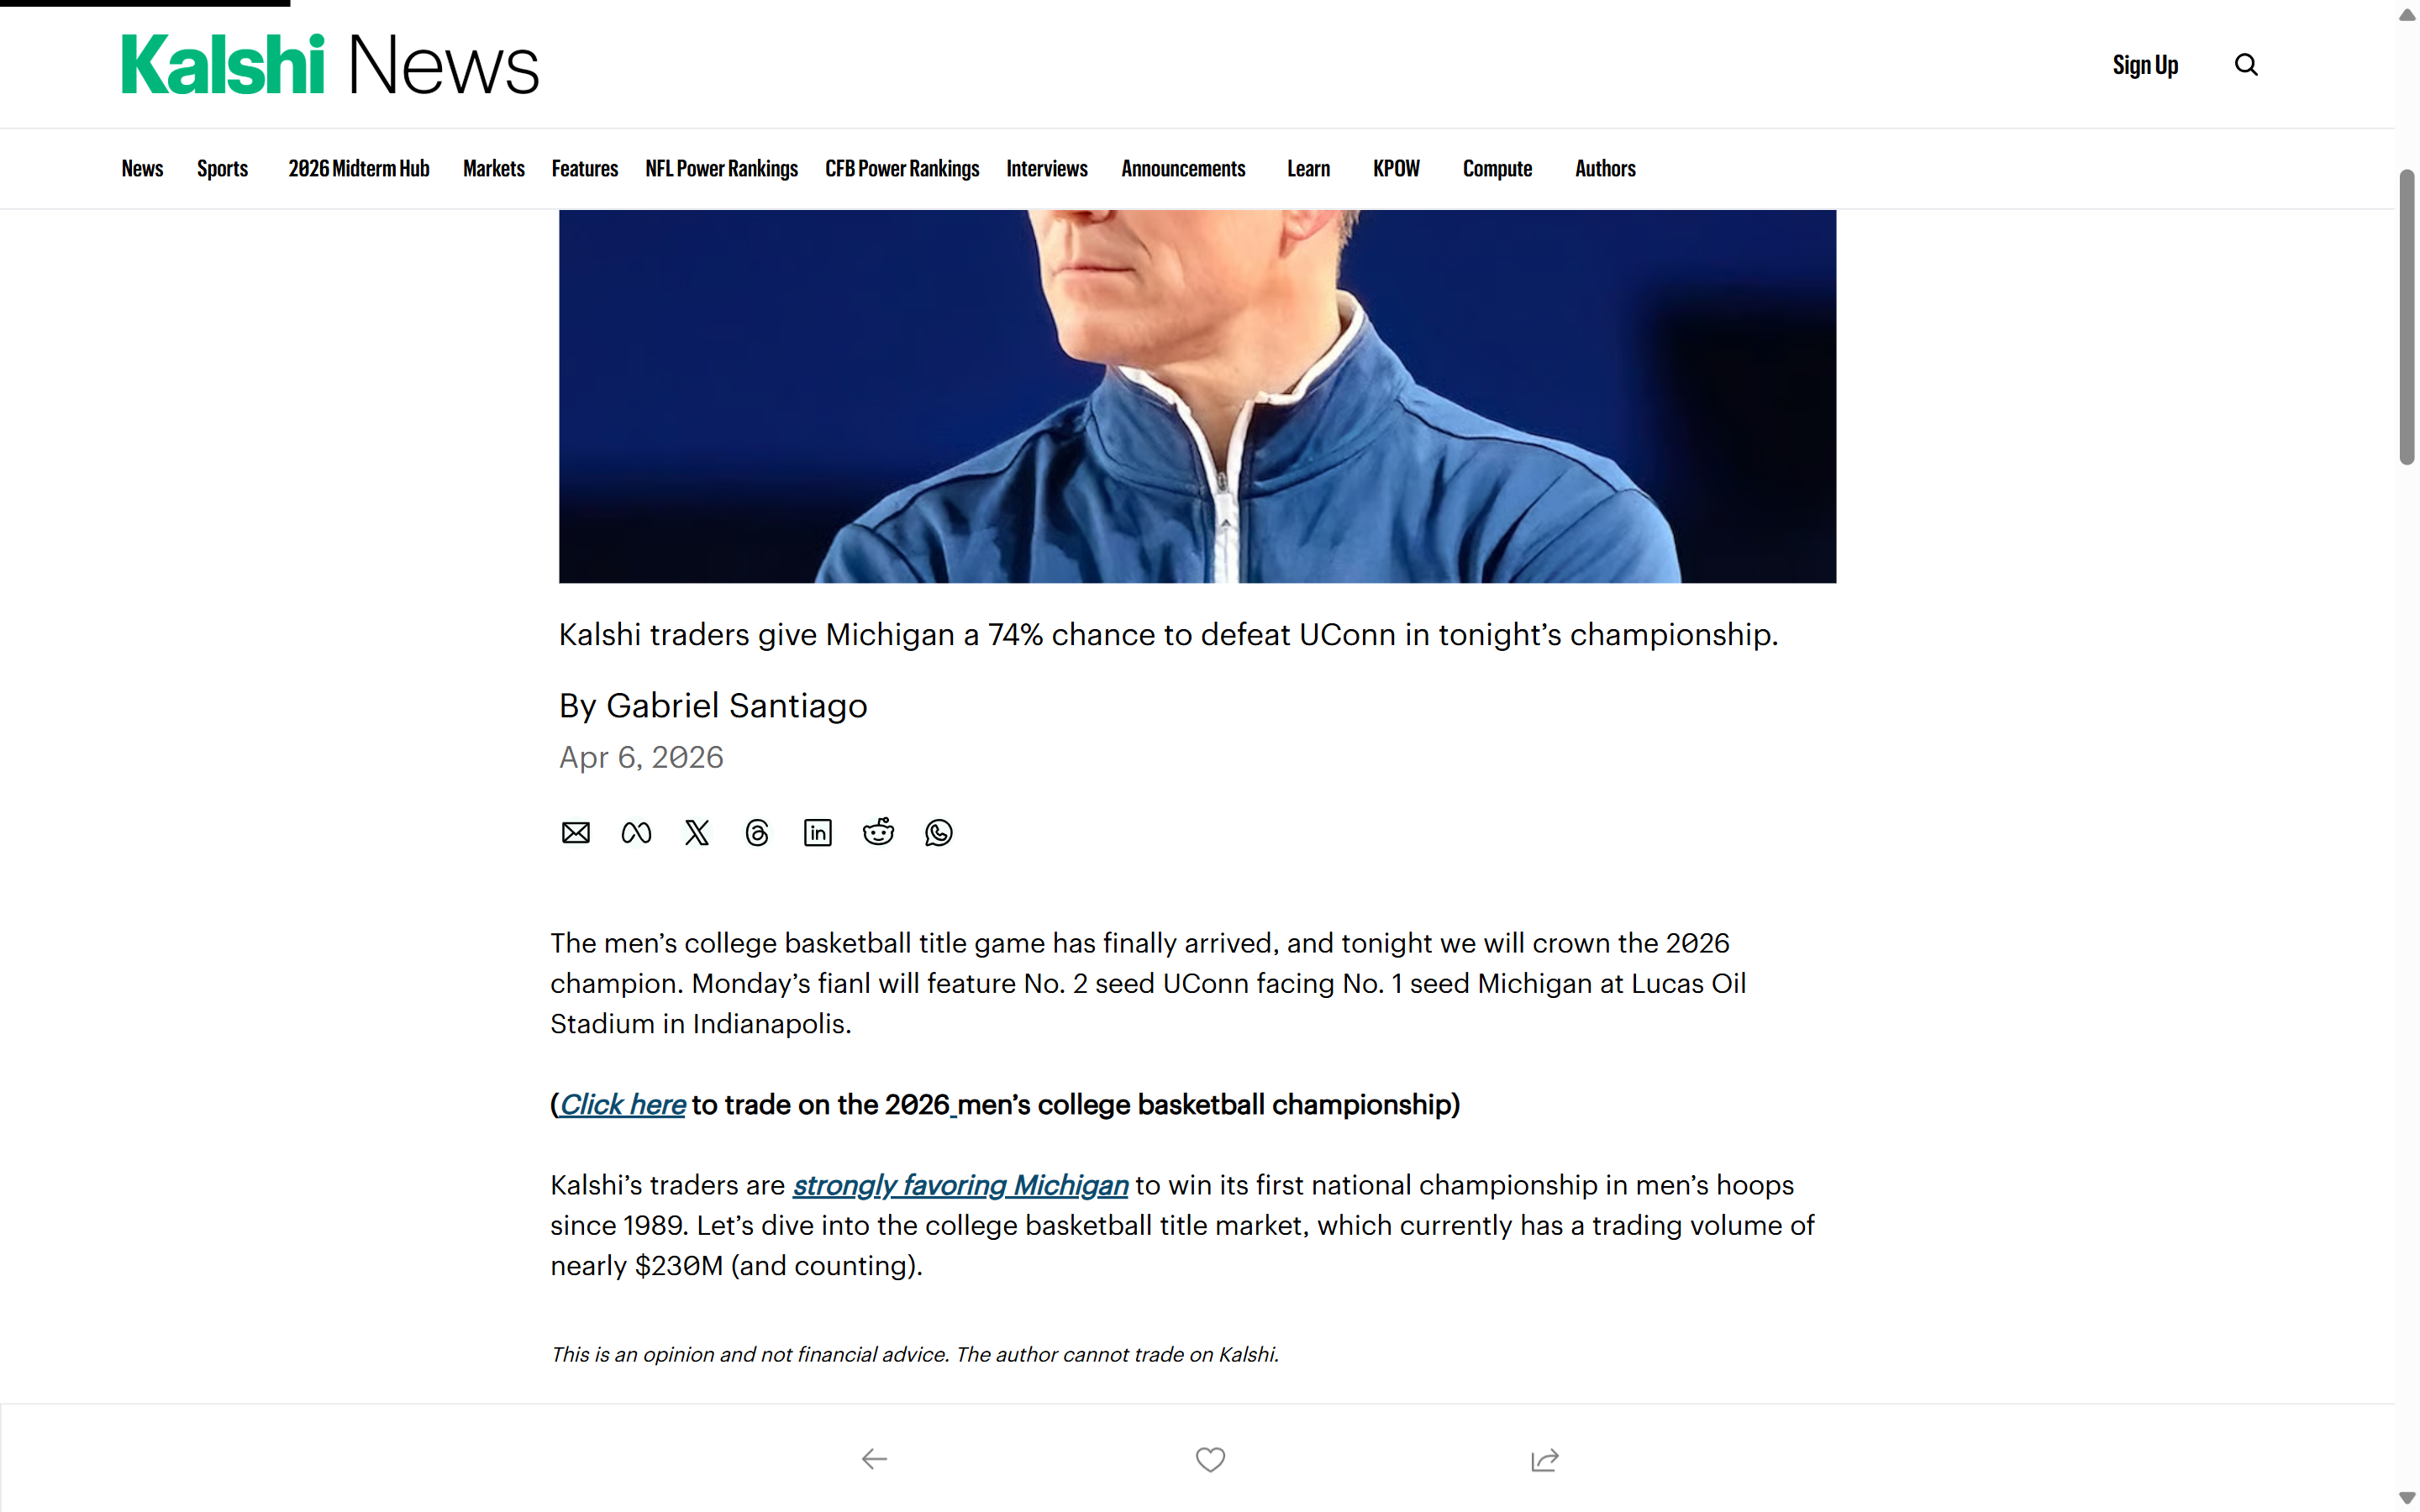
A news snapshot does not establish the exact tipoff price, an executable bid or ask, or the available size. Its value here is its date and explicit attribution. It supports saying that this report presented Michigan as the favorite before the result. One favorite winning is not enough to measure a forecasting system’s calibration; that requires a larger set of predictions evaluated consistently.
3. The resolved markets and their displayed volume
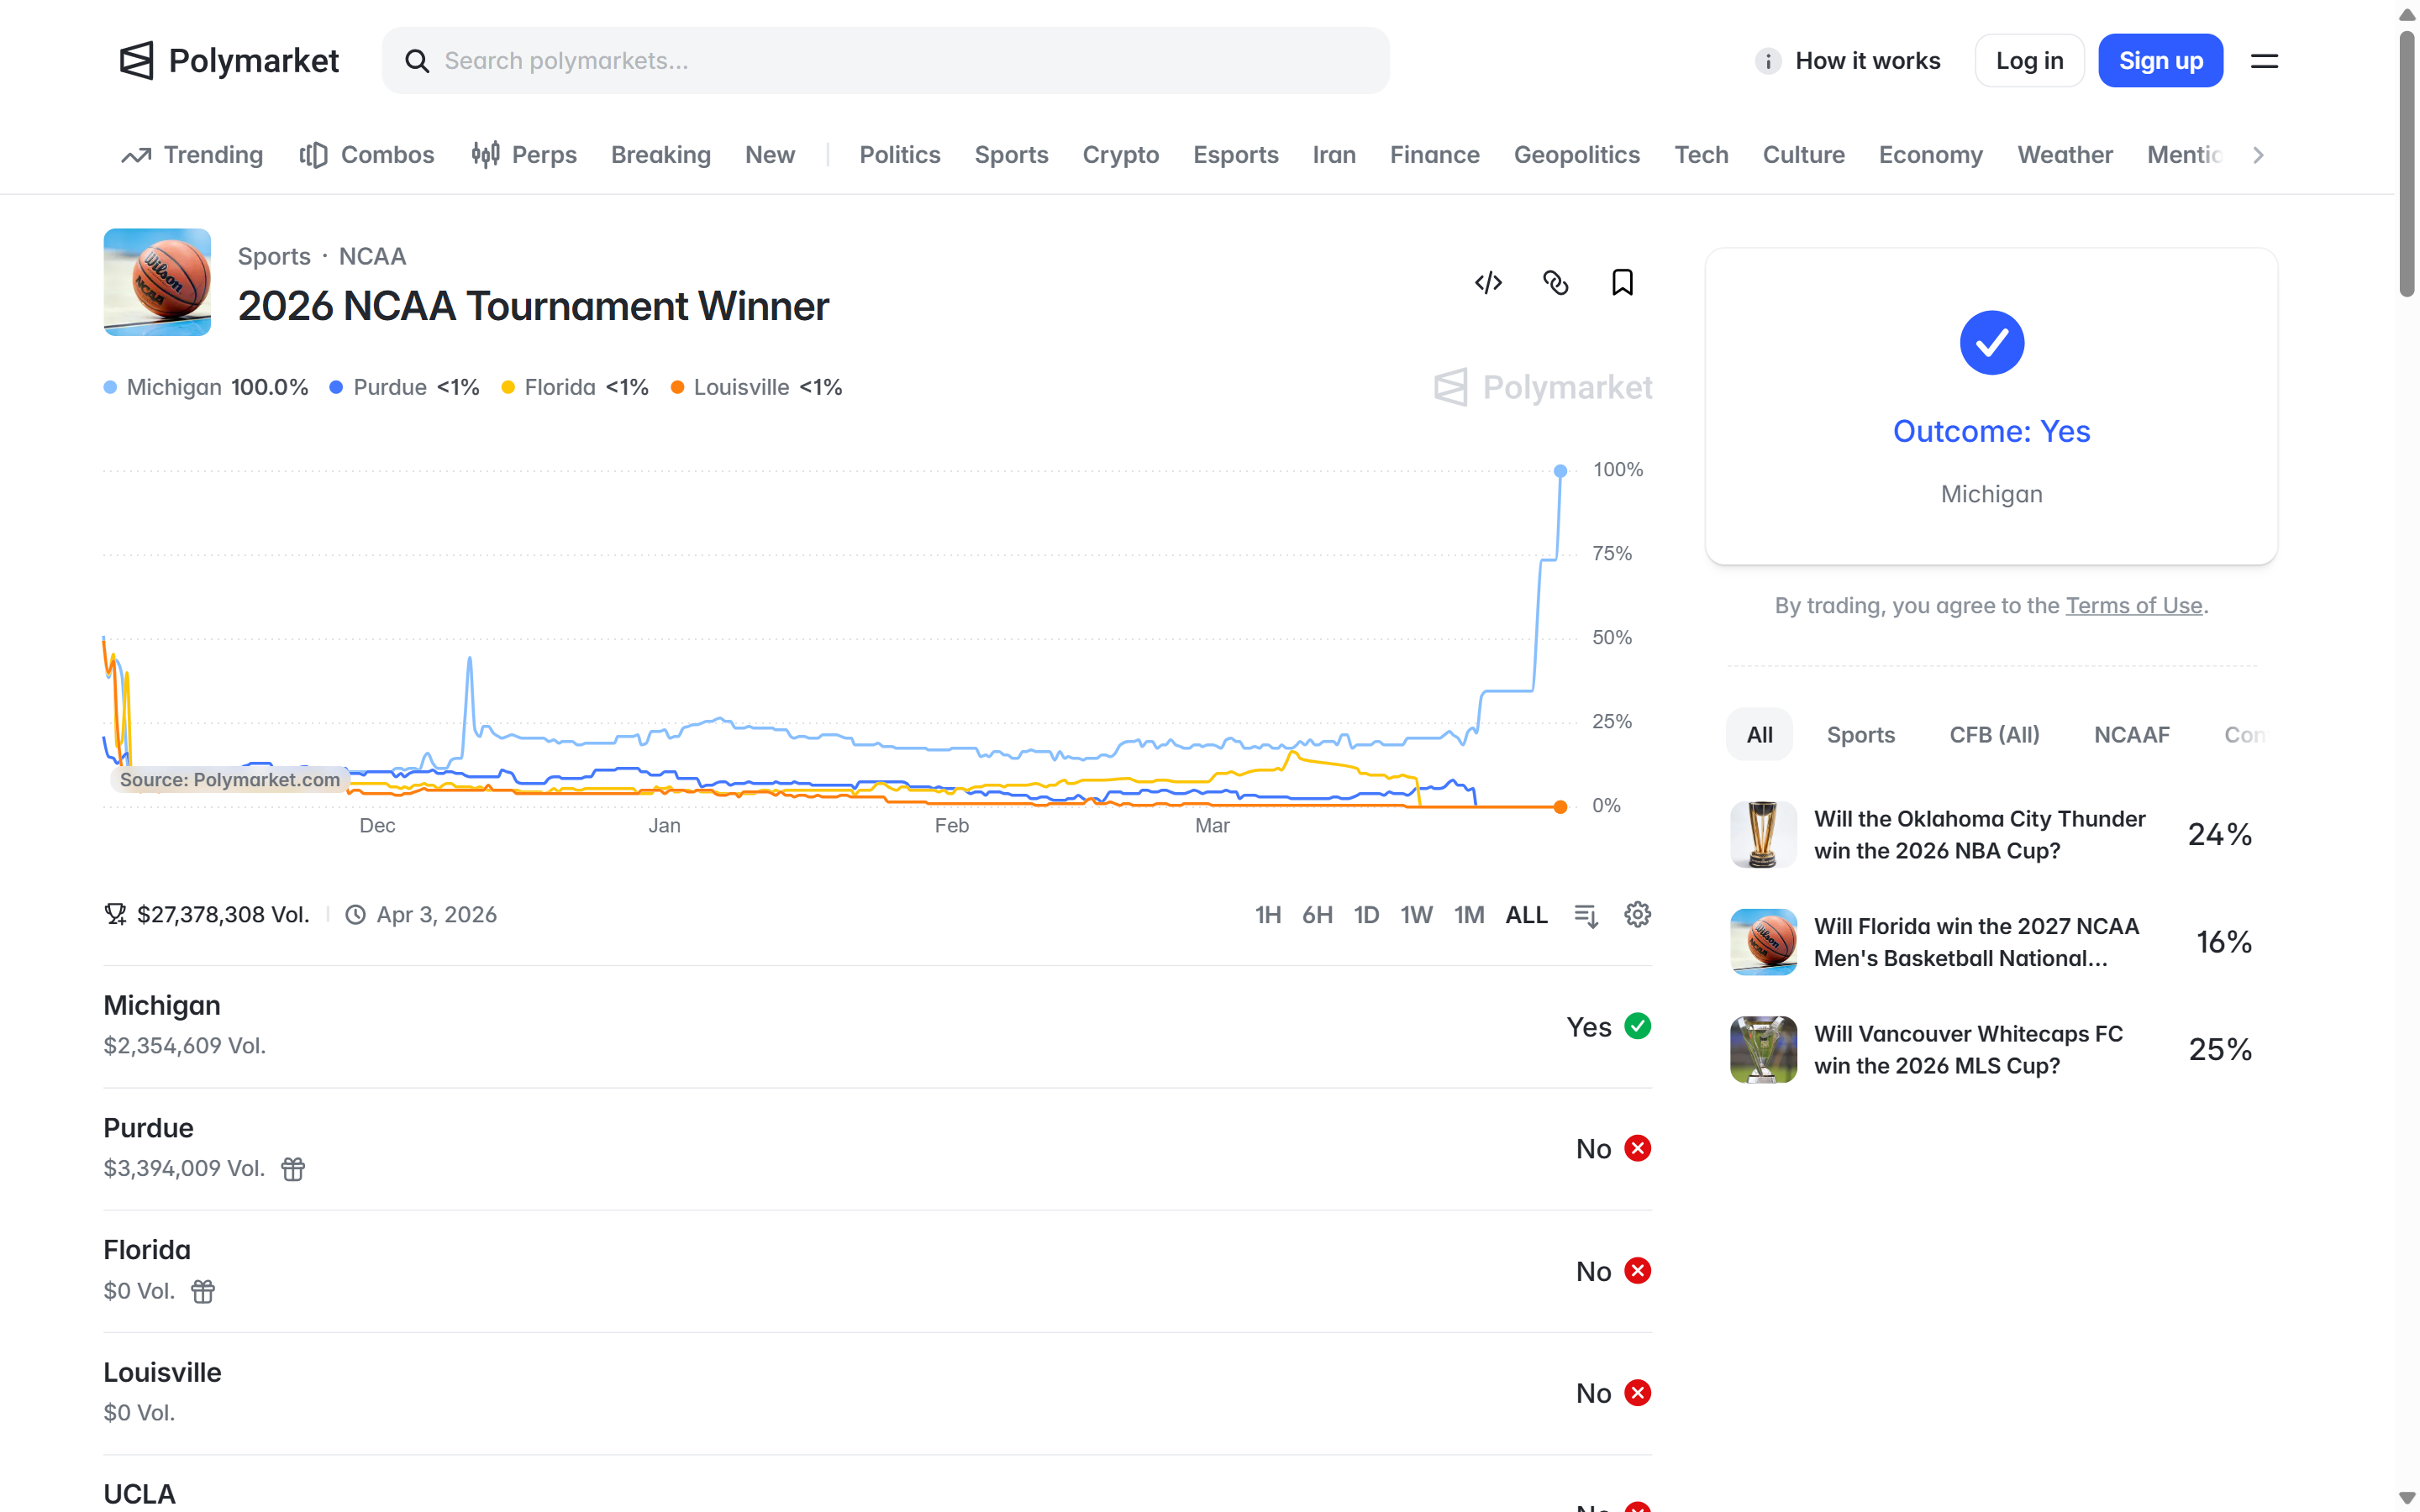
Polymarket’s completed 2026 NCAA Tournament Winner page displays Michigan Yes and event volume of $27,378,308. The Michigan row shows $2,354,609. Those figures refer to different scopes: the event and one team outcome. Neither represents the amount won by Michigan backers.
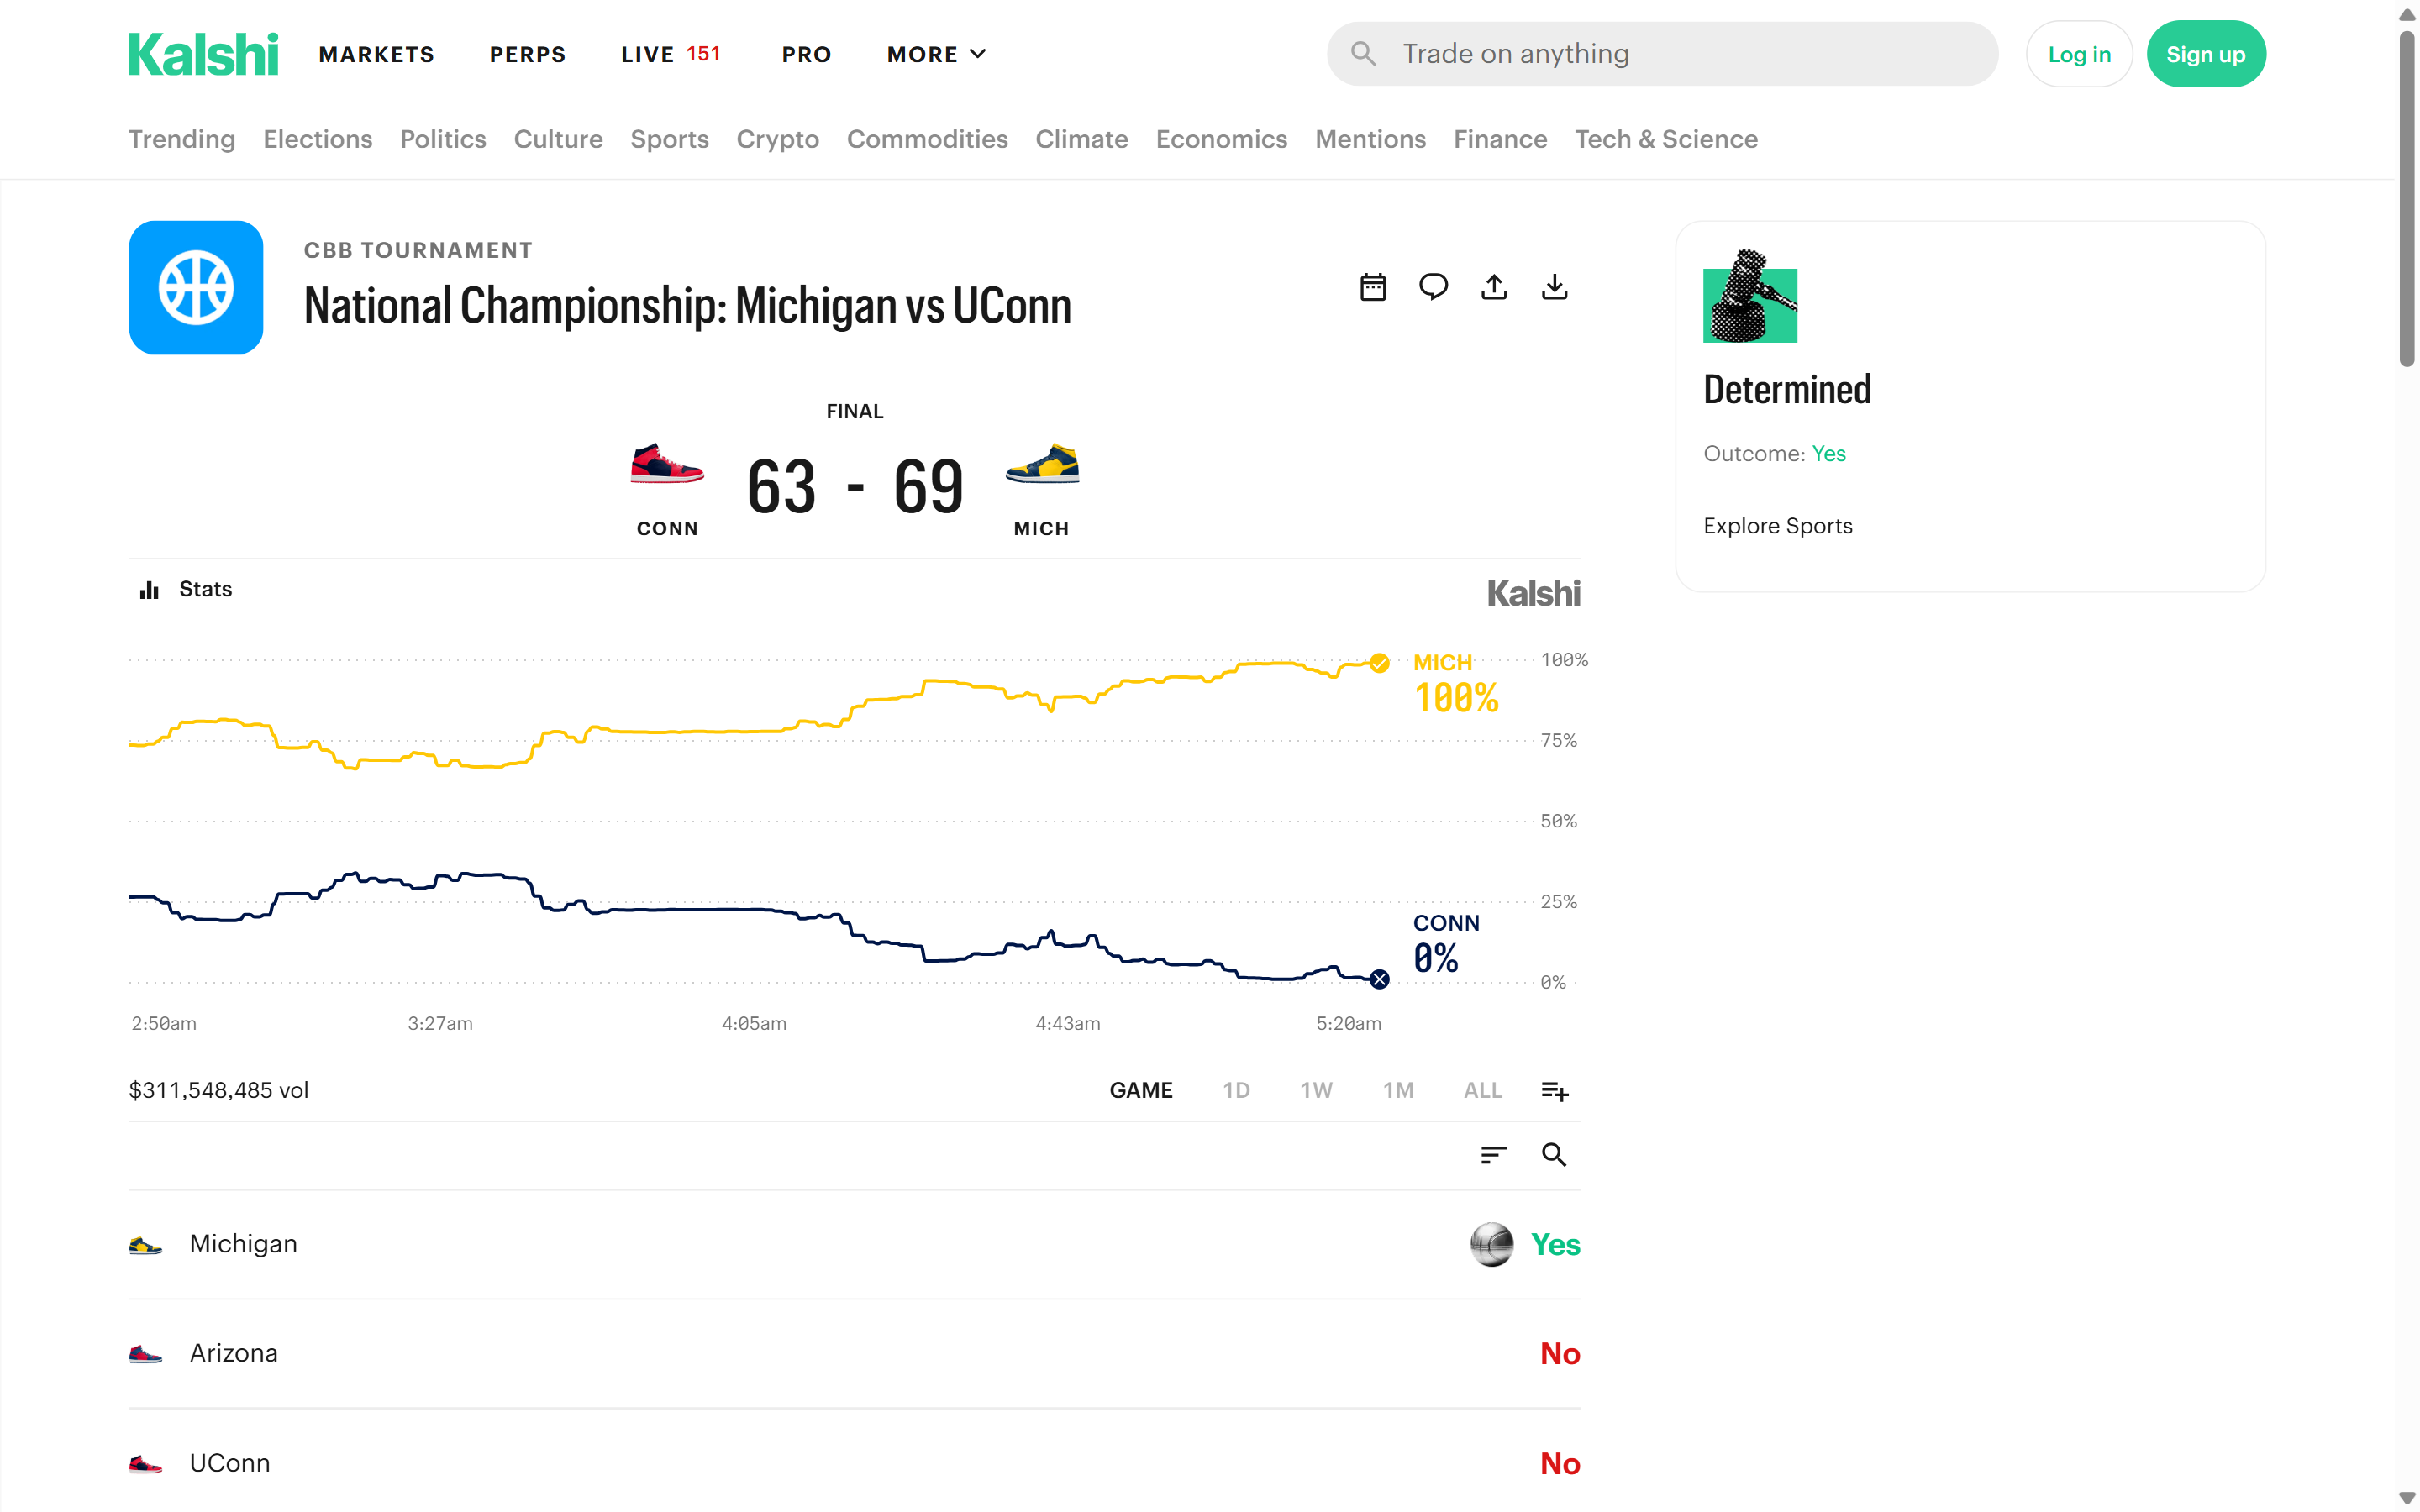
The matching Kalshi event is KXMARMAD-26. Its resolved championship view displays Michigan 69, UConn 63, Michigan Yes and $311,548,485. Its GAME chart ends at Michigan 100% and UConn 0%. These are observations of the completed page on October 8, rather than a claim that the same total was visible before tipoff.
| Source | Observation | Meaning |
|---|---|---|
| Kalshi News, April 6 | Michigan 74%; UConn 27¢; nearly $230M | Dated pre-final report |
| Polymarket, October 8 capture | $27,378,308; Michigan Yes | Completed event display |
| Kalshi, October 8 capture | $311,548,485; Michigan Yes | Completed event display |
The earlier Kalshi report and later completed page are not conflicting measurements of one instant. They were observed at different stages. Nor is their difference a measured in-game turnover figure: that would require matching snapshots and consistent scope. We do not add the venue totals into a claim about all college basketball trading or compare them as though their volume conventions were identical.
Cumulative turnover also does not measure order-book depth. A large historical total can coexist with little size available at a particular price. To evaluate a trade, retain the order book and quote type at the time; the final page cannot supply them retrospectively. See our guide to reading probability movements.
4. Rules, resolution and payout are separate records
Polymarket’s event rules ask who wins the 2026 NCAA tournament. They allow a team to resolve No when eliminated and specify an Other fallback if no winner is declared by December 31, 2026 at 11:59 p.m. ET. That contingency is a contract provision, not evidence that settlement waited until December.
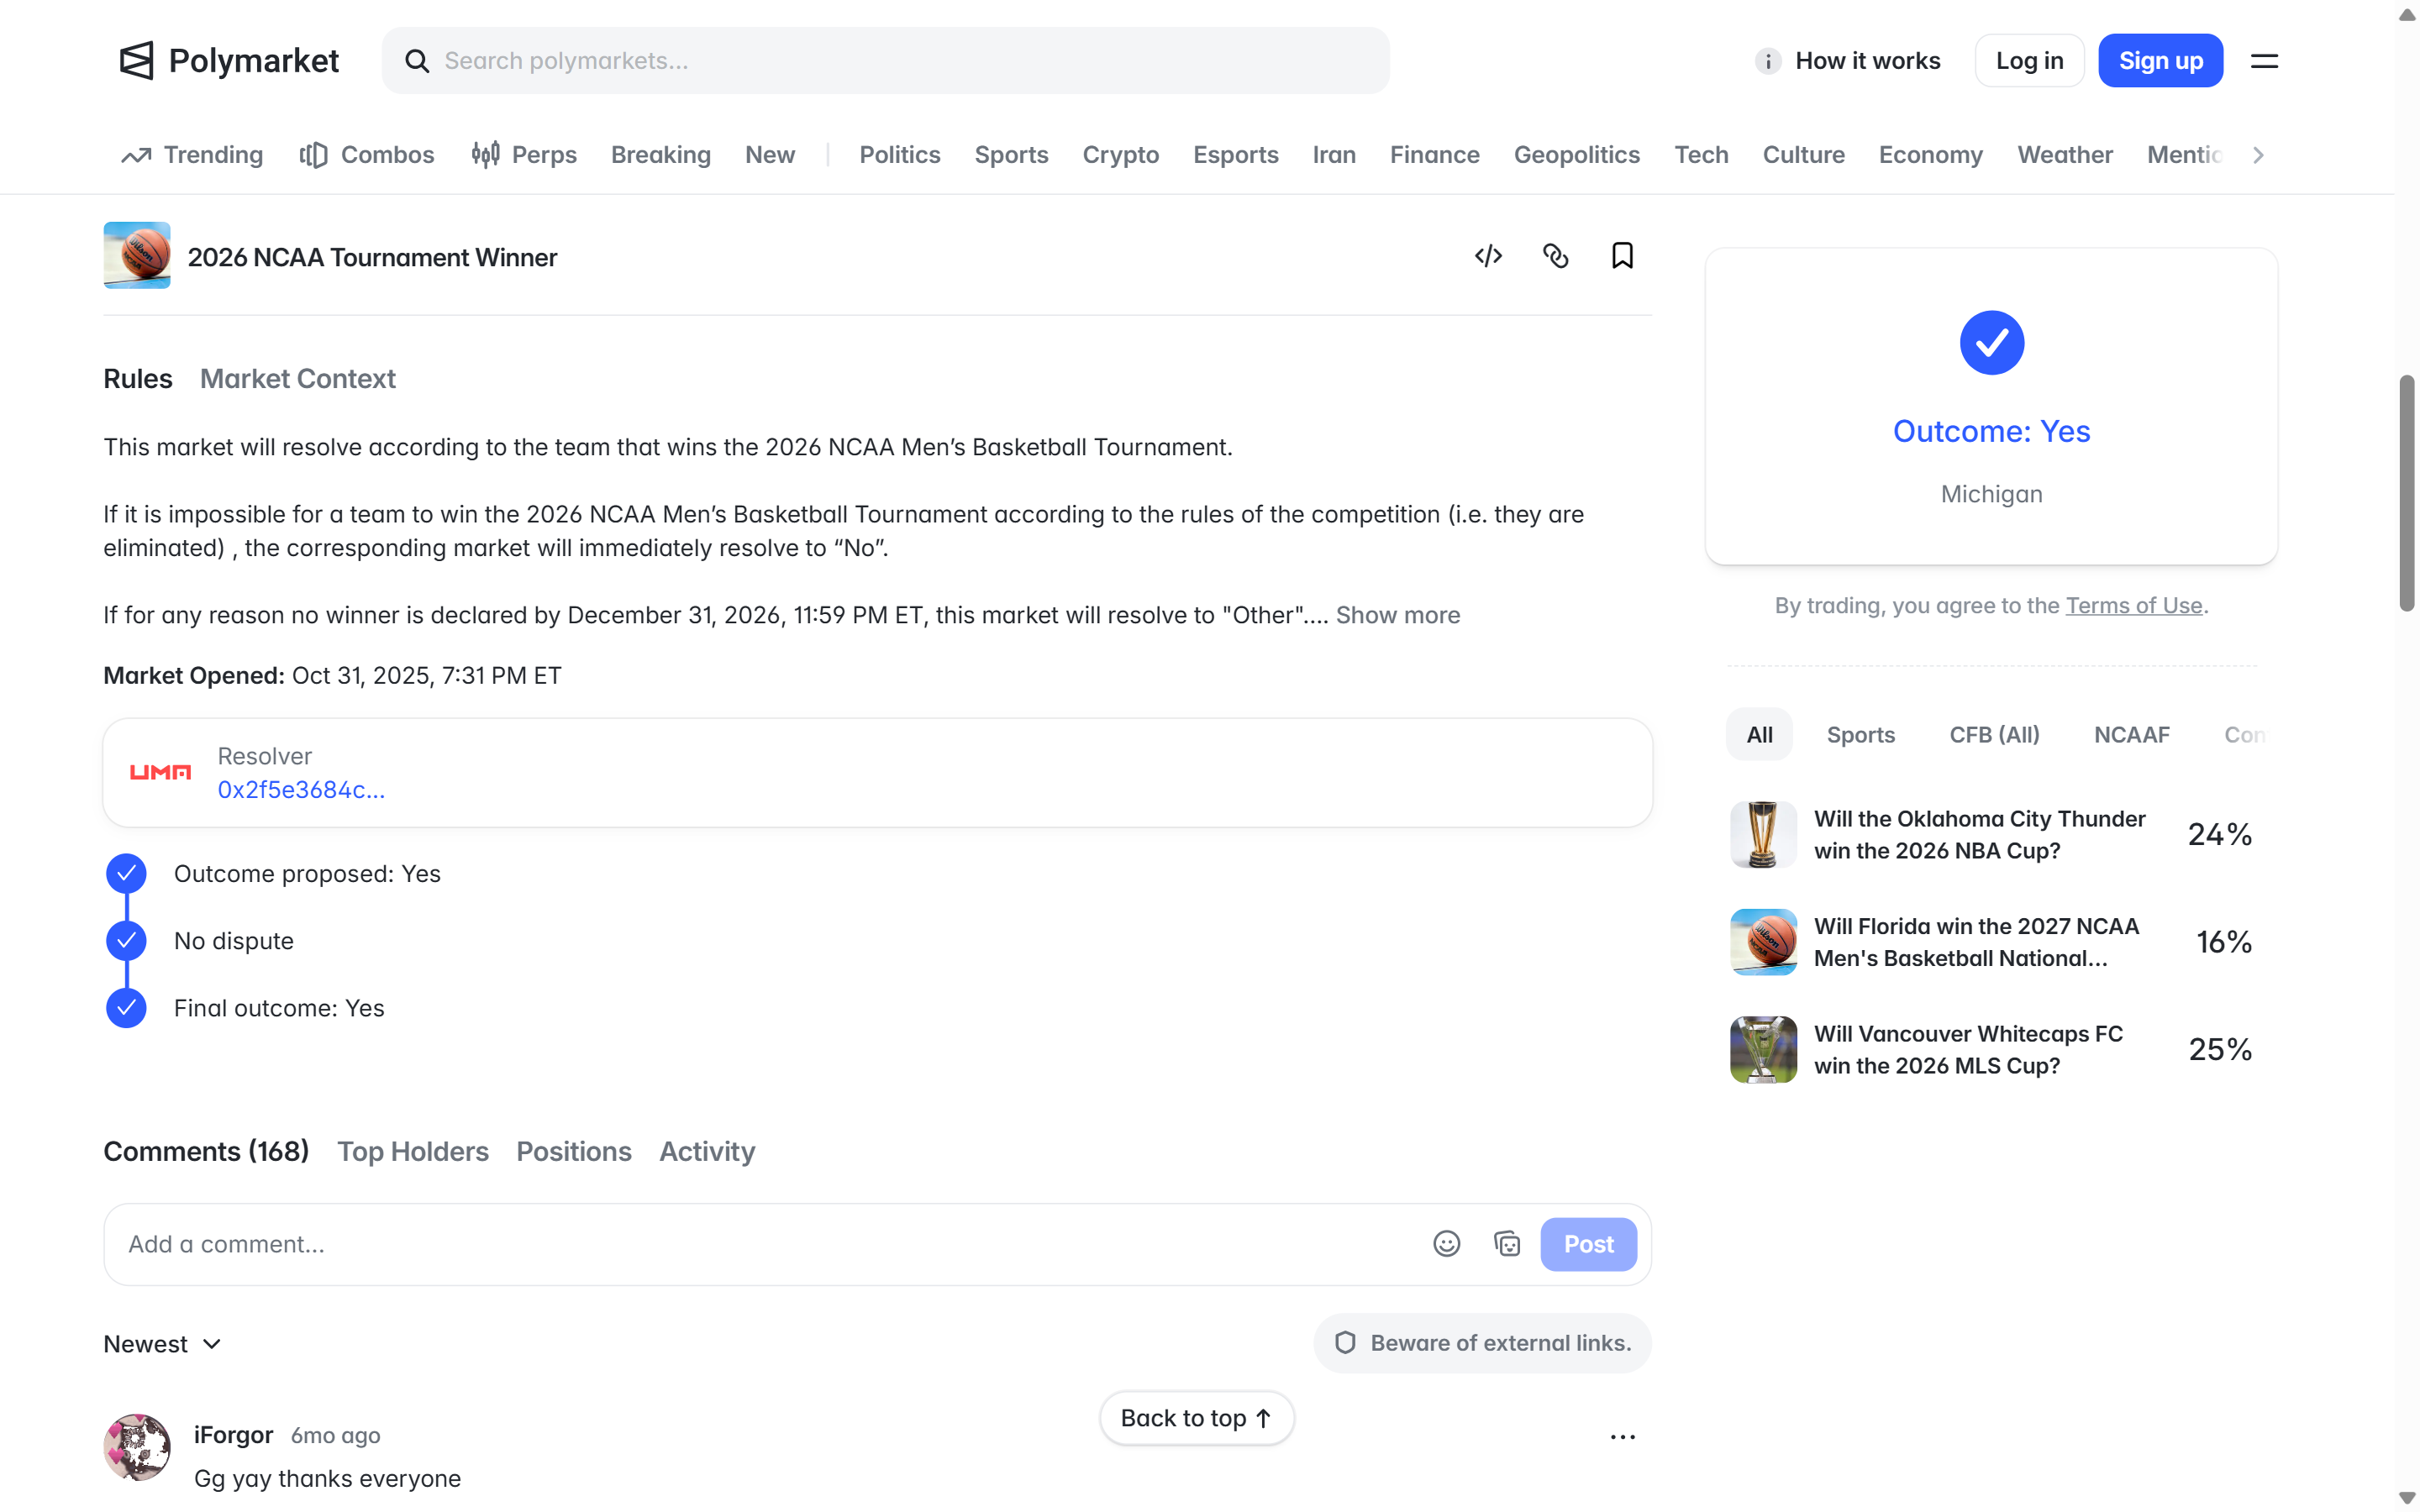
The selected Michigan panel displays a Yes proposal, no dispute and a final Yes. The rules name the NCAA as the source. The screenshot shows only part of the rules; the full page text was also read. A resolver address and a displayed final state do not independently prove a transaction’s execution time or an individual holder’s redemption.
Polymarket’s resolution documentation explains the proposal/dispute mechanism and $1 redemption for winning tokens. Its trading documentation describes an order-book system. Neither document establishes that every trade in this historical event was fee-free.
The Kalshi event’s rules panel specifies the 2025–26 Division I men’s champion. Its displayed source list includes ESPN, The Wall Street Journal and the Associated Press, plus another source; that is not an NCAA-only source list. The timeline displays payout 30 minutes after closing. This label is not an ACH transfer time or evidence that every user withdrew funds then. The distinction is explained further in our market resolution guide.
5. What Manifold adds—and what it cannot date
The Manifold tournament market resolves Michigan at 100%, with 73% struck through next to that final result. UConn’s row has a struck-through 27%. The header shows approximately M96k of Mana volume. This is a community market display, not a dollar-volume measurement comparable with either venue above.
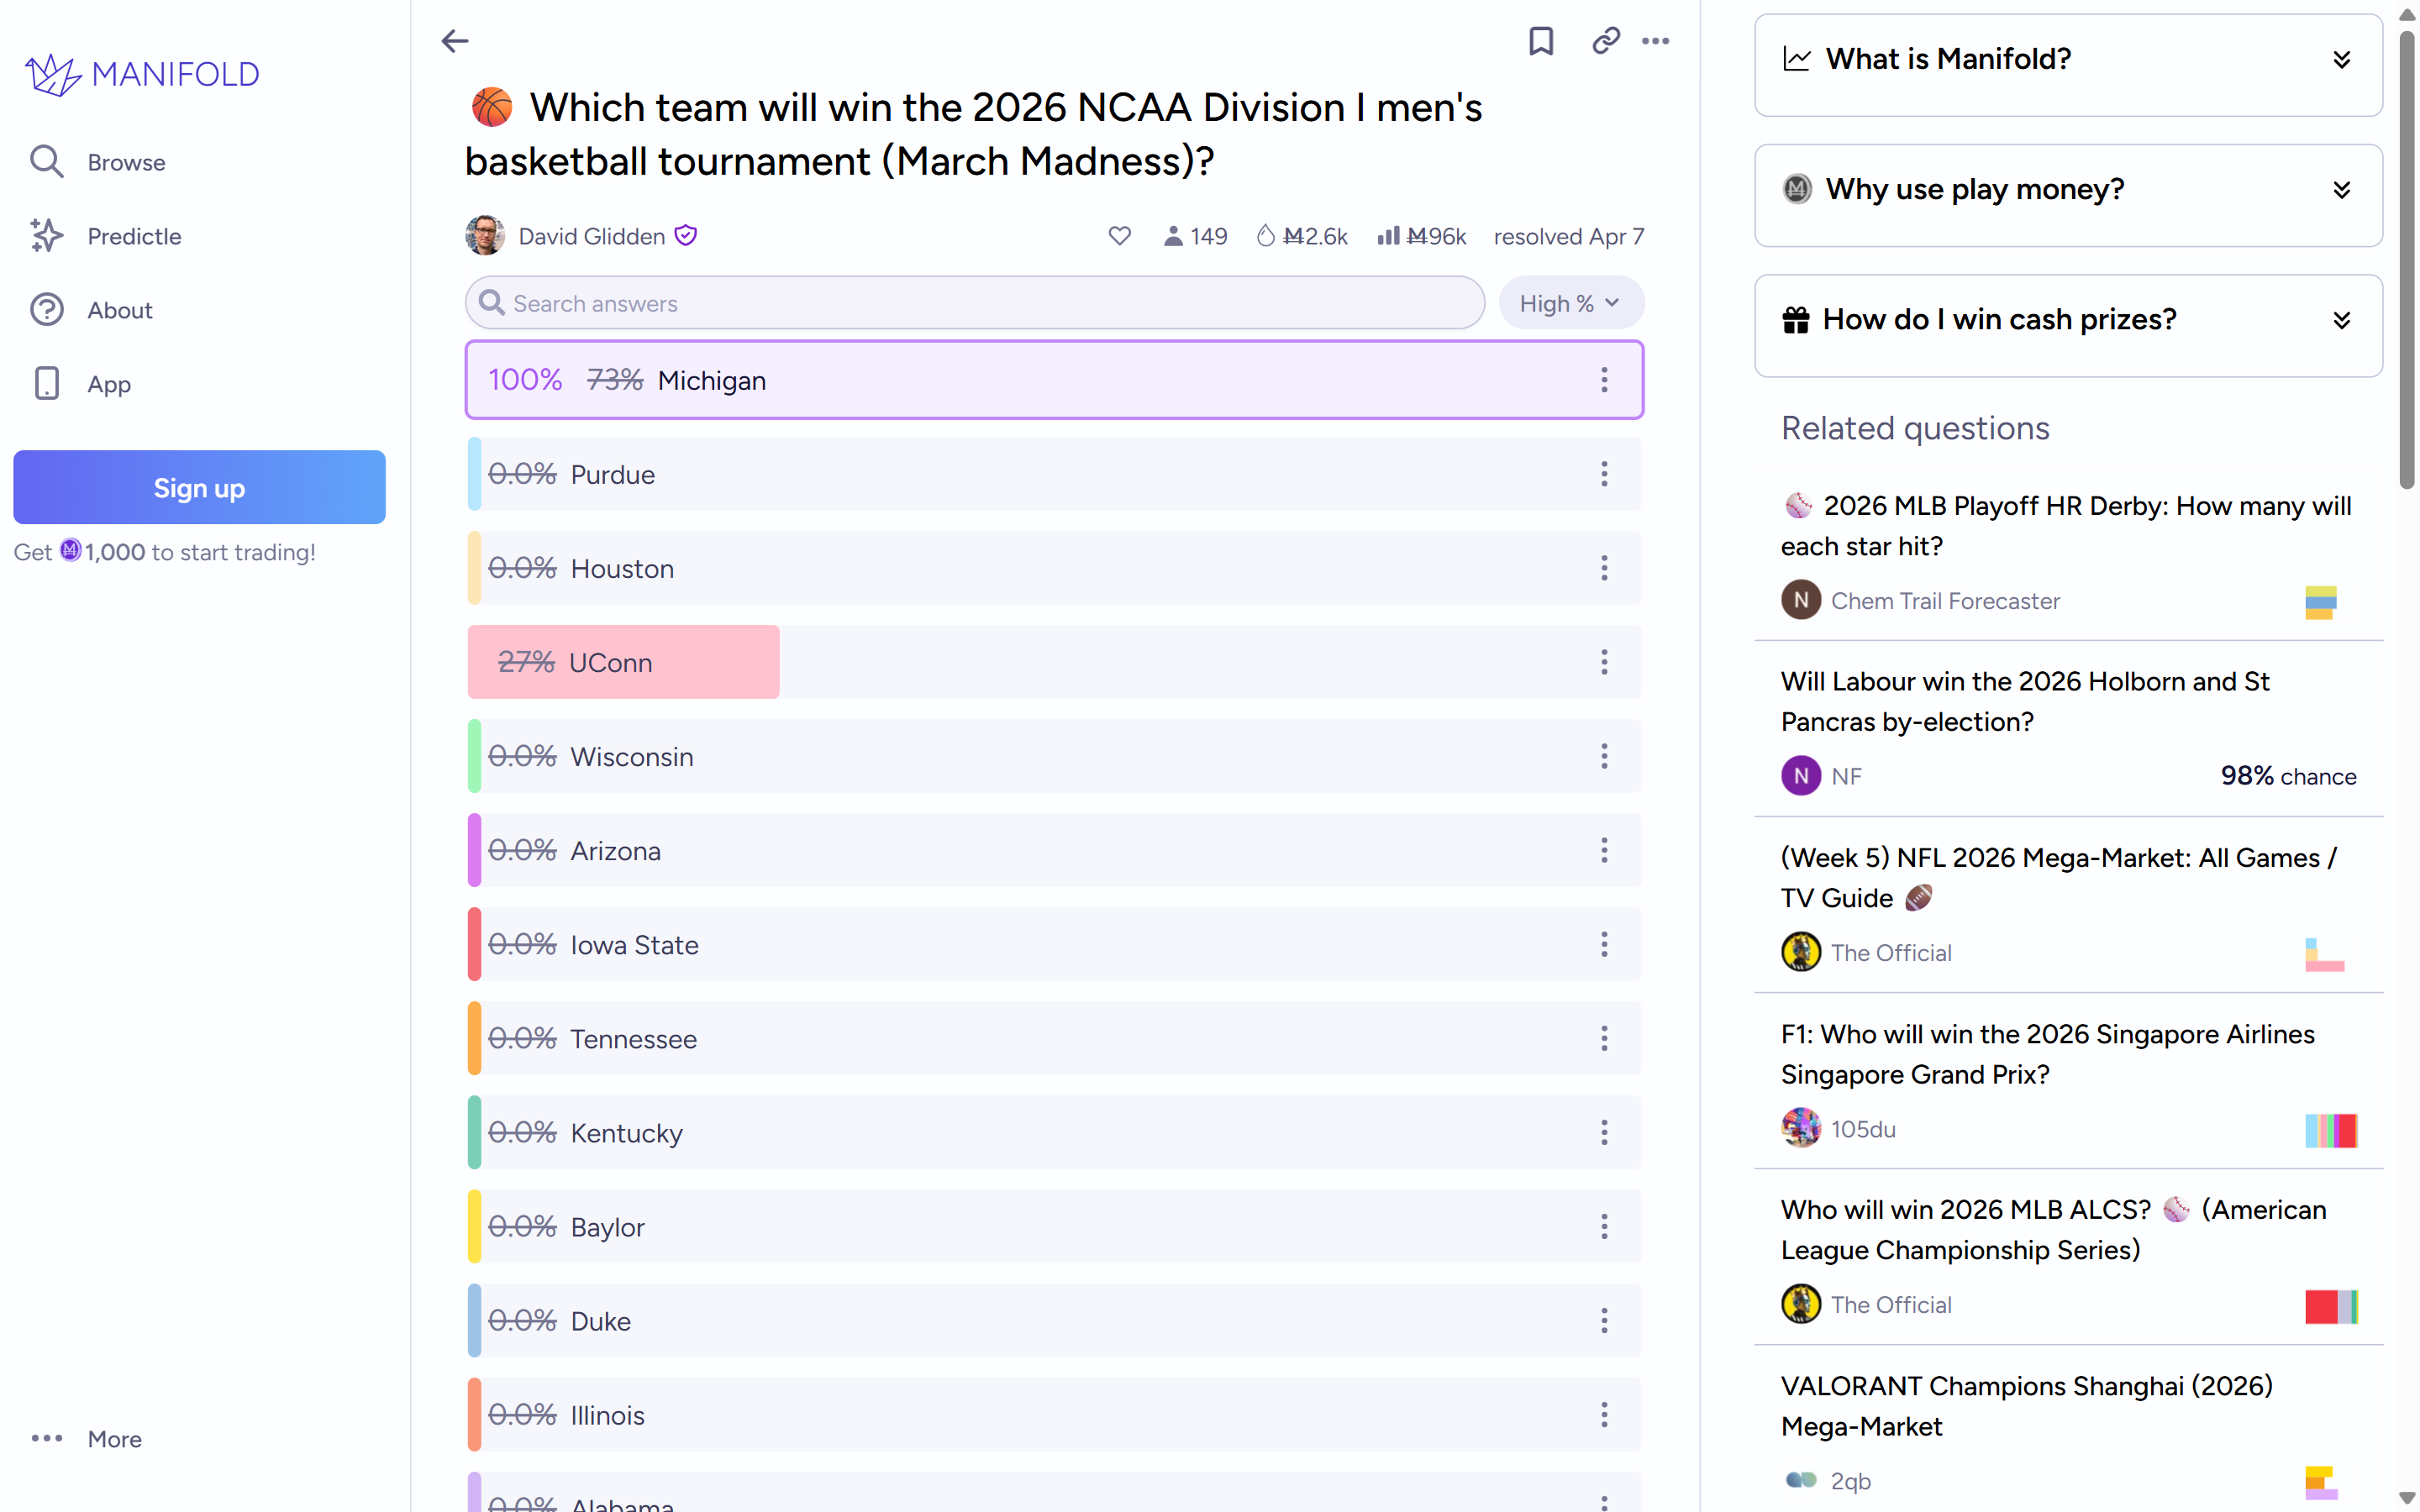
The screenshot does not establish when the struck-through 73% was quoted. It therefore cannot be described as a contemporaneous tipoff forecast or used to prove that Manifold, Polymarket and Kalshi agreed at the same moment. To make that comparison, all three observations would need timestamps and matching contract definitions.
6. A useful payoff example, with its limits
Hypothetical example: suppose a trader could buy 100 Yes contracts at $0.74 and each winning contract redeemed for $1. The purchase would cost $74; gross redemption would be $100; gross profit would be $26, or approximately 35.14% of the purchase cost. A losing outcome would instead lose the $74 cost. Fees and execution costs would change the net result.
The 74% news quote motivates the arithmetic, but the report does not prove that 100 contracts were available at 74¢. The distinction matters: a published probability, a displayed quote and a completed trade are different records. Our Polymarket review provides platform context without turning this illustration into a historical trading claim.
7. The practical lesson
Use the dated 74% report when discussing the pre-final forecast. Use the official 69–63 result for the sports outcome. Use the matching event rules and resolved panels for the contract outcome. Use trade records for entry price, spread and profit. The genuine GAME chart is useful visual context, but we do not assign exact clock times to game events or infer a 49¢ halftime low from it.
Correction note: this revision corrects Michigan’s seed, tournament opponents, venue, attendance and halftime score. It replaces the unsupported $284.14M headline, next-season catalog screenshot, precise historical price ladder and synthetic hero chart. It removes unverified bid–ask, fee, automated-trading and bank-payout claims. The six figures are fresh native captures; the hero uses the genuine Kalshi chart.
Risk disclosure: this article is educational, not a trading recommendation. Event contracts can lose their full purchase cost plus applicable fees. A favorite winning does not establish that buying it was profitable at every price.